Understanding Your Glucose Metrics in the Gurucose App
Track your glucose trends with the Gurucose App! Monitor average glucose, time in range, eHbA1c, and variations. Get insights for better diabetes management with color-coded graphs and real-time data.
Managing diabetes is all about tracking the right numbers, and the Gurucose App makes it easier by giving you key insights from your CGM data. The app calculates these metrics over 7 days, 14 days, and 90 days so you can see both short-term trends and long-term patterns. Let’s break down what these numbers mean and how they help you stay in control.
Average Glucose – Your Blood Sugar Snapshot
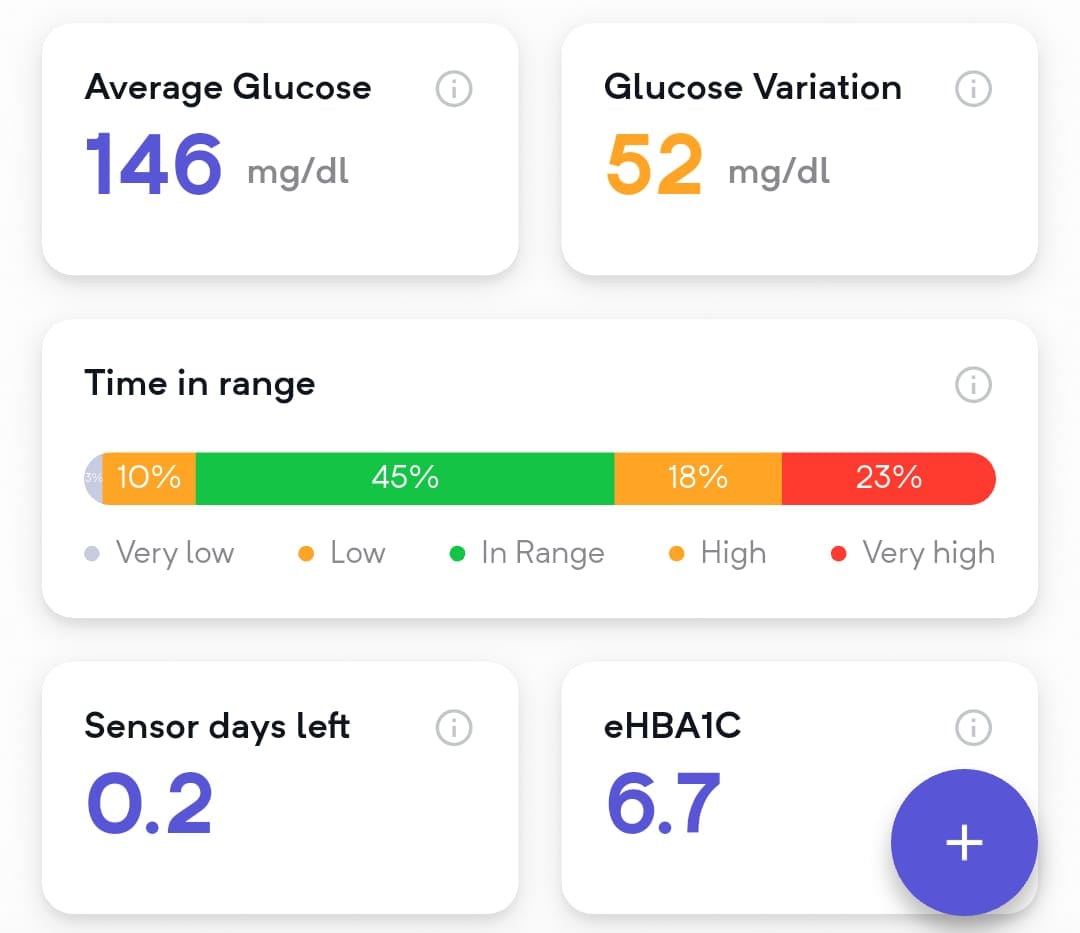
This is the average blood sugar level over the selected time period. CGMs collect readings in two ways—every 15 minutes automatically and when you scan manually. We take an average of these readings and display it in the app. This metric helps you understand how well your glucose levels are managed over time.
Glucose Variation – How Steady is Your Blood Sugar?
This tells you how much your glucose levels fluctuate by calculating the standard deviation of your CGM readings. A lower variation means more stable blood sugar, while a higher variation indicates frequent ups and downs. The goal is to keep fluctuations in check to avoid frequent highs and lows.
Time in Range (TIR) – How Often is Your Sugar in the Safe Zone?
This shows what percentage of your readings fall within different glucose ranges – 70 - 90 mg/dL, 90 - 150 mg/dL, 150 - 180 mg/dL, Above 180 mg/dL
Knowing how often your sugar levels are within the target range (70-180 mg/dL) helps you adjust your diet, exercise, or medication for better glucose control.
Sensor Age – How Old is Your CGM Sensor?
This tells you how many days your sensor has been in use since your last scan. Keeping track of this helps ensure you replace it on time for accurate readings.
eHbA1c – A Glimpse of Your HbA1c
Your estimated HbA1c (eHbA1c) is calculated based on your average glucose levels. While it may not always match your lab-tested HbA1c, it gives you a good idea of where your levels stand over time.
Graph Colors – Making It Easy to Spot Trends
The color-coded graph helps you quickly see where your glucose levels are:
🔴 Below 70 mg/dL – Red (Low Blood Sugar)
🟠 70 - 90 mg/dL – Orange (Lower Range)
🟢 90 - 150 mg/dL – Green (Target Range)
🟠 150 - 180 mg/dL – Orange (Upper Range)
🔴 Above 180 mg/dL – Red (High Blood Sugar)
This visual representation makes it easier to understand patterns and take action when needed.
With these simple but powerful metrics, the Gurucose App helps you track your glucose trends, detect fluctuations, and make informed decisions for better diabetes management. Stay in control, stay informed, and let the numbers guide you toward better health!
If you haven’t already, download the Gurucose app from the App Store or Play Store and connect your CGM!